A fever with depth
Ocean heat is easy to misunderstand because the ocean hides its own drama. The surface can look calm while enormous amounts of energy move through layers most people will never see.
WMO, NASA, Copernicus, and Argo all describe the same basic reality: the ocean is the planet's great heat reservoir, and modern observation now measures that heat from the surface into the deep water column. [1][6]
That matters because air temperature is the noisy headline, while ocean heat content is the long account book. The ocean records what the planet has absorbed even when weather distracts us.
Put plainly, this is where the large system becomes readable. The policy language, engineering vocabulary, scientific measurement, and market signals all matter, but the test is more ordinary: whether people can see the risk early enough to make a better decision before the failure becomes personal.
The danger is not only warmer beaches. It is the stored energy that changes storms, marine ecosystems, sea level, oxygen, fisheries, and the timing of life in the water. [5][2]
For coastal communities, the fever can arrive as a flood tide, a dead reef, a closed fishery, a stronger downpour, or a summer when the water itself feels wrong.
The everyday stakes are the reason the receipts matter. A source note can look small at the bottom of a page, but each one is a handhold for the reader: a way to separate what the story knows from what it argues, what has been measured from what still has to be judged.
The more the ocean stores, the less the problem can be dismissed as a bad season. A fever with depth is harder to cool.
Coral is the alarm that changes color
Coral bleaching is one of climate science's cruelest visual aids. The animal does not shout. It pales, losing the symbiotic algae that help feed it when heat stress lasts too long.
NOAA's confirmation of the fourth global bleaching event and Coral Reef Watch's satellite heat-stress tools show how reef crisis moved from local observation into global monitoring. [3][4]
The power of the bleaching signal is that it is biological and visible. A reef can translate ocean heat faster than a chart can, because the change is written on living color.
Put plainly, this is where the large system becomes readable. The policy language, engineering vocabulary, scientific measurement, and market signals all matter, but the test is more ordinary: whether people can see the risk early enough to make a better decision before the failure becomes personal.
Bleaching does not automatically mean death, but repeated or prolonged heat leaves less time for recovery and more room for algae, disease, and reef breakdown. [8][2]
Try the thermometer test
If a single hot day does not define climate, a single cool day does not erase it. Ocean heat content matters because the ocean stores the long memory of the energy imbalance, smoothing the noise that can distract us at the surface.
A reef is food, shoreline protection, tourism, cultural identity, and astonishing life. When it pales, the loss is ecological before it becomes economic, but it becomes economic quickly.
The everyday stakes are the reason the receipts matter. A source note can look small at the bottom of a page, but each one is a handhold for the reader: a way to separate what the story knows from what it argues, what has been measured from what still has to be judged.
The reef alarm is not subtle. It is asking whether the world can reduce heat stress fast enough for recovery to remain a real word.
The thermometer is a network
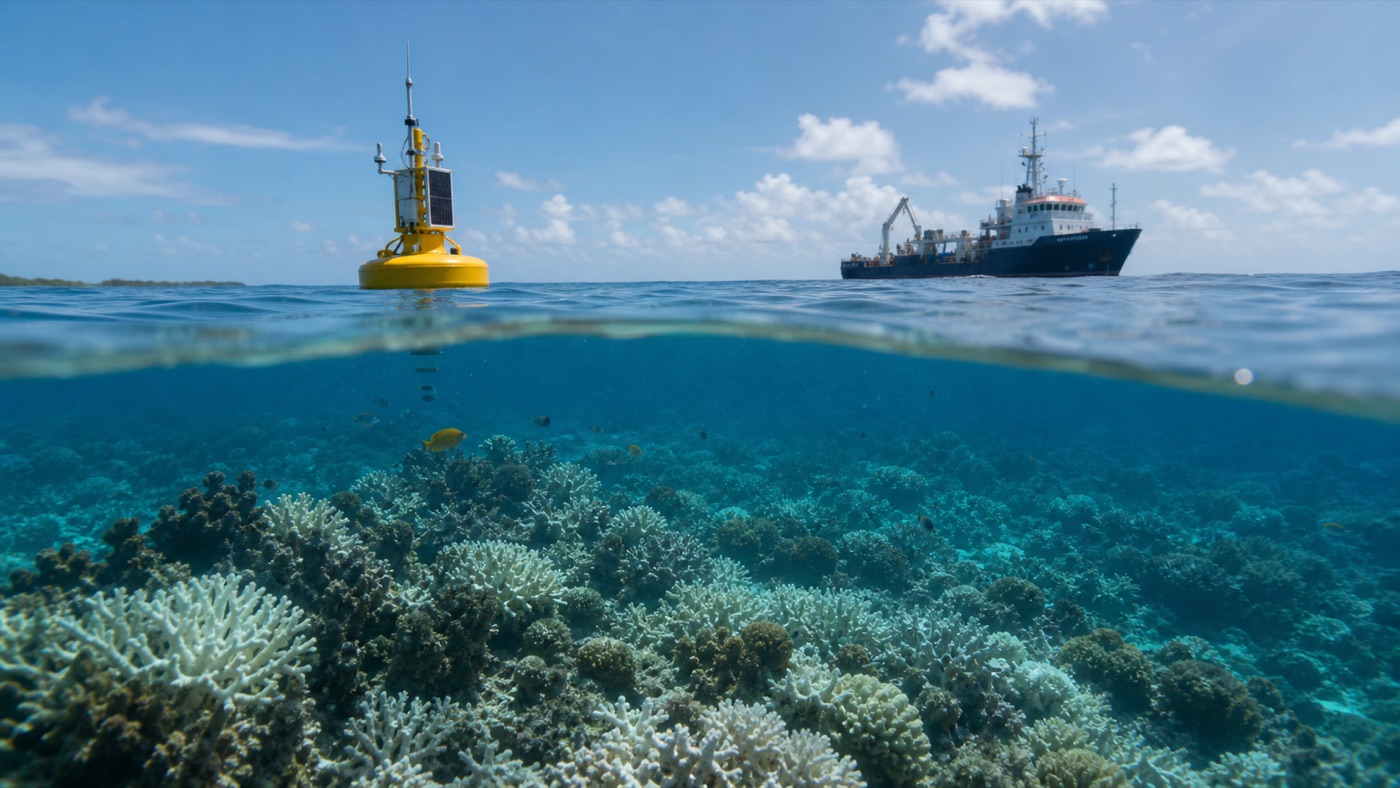
There is no single thermometer for the sea. There are floats, satellites, tide gauges, buoys, ships, gliders, moorings, and scientists arguing carefully about uncertainty.
Argo's global float array, NASA's climate indicators, UNESCO ocean reporting, and IPCC assessments show how measurement has become an infrastructure story as much as a science story. [5][9]
This is why ocean heat is not just a vibe from a hot beach. It is a measured, checked, repeated signal produced by instruments that move through the water and systems that read from above.
Put plainly, this is where the large system becomes readable. The policy language, engineering vocabulary, scientific measurement, and market signals all matter, but the test is more ordinary: whether people can see the risk early enough to make a better decision before the failure becomes personal.
Observation still has gaps. The deep ocean, polar regions, coastal shelves, and biological effects are hard to measure perfectly, which means better data can change details without changing the main direction. [6][7]
The public rarely sees the float that surfaced, sent a burst of data, and sank again. But that quiet machine is part of the reason the story can be told with confidence.
The everyday stakes are the reason the receipts matter. A source note can look small at the bottom of a page, but each one is a handhold for the reader: a way to separate what the story knows from what it argues, what has been measured from what still has to be judged.
The next breakthrough may be less spectacular than a new satellite launch. It may be the steady thickening of an observing network that makes the ocean harder to ignore.
Warm water is storm fuel, not a storm script
It is too simple to say a warm ocean creates every storm. Weather is not a vending machine. But warm water changes the conditions under which storms form, intensify, rain, and damage coasts.
Climate assessments and NOAA explainers connect ocean heat with evaporation, moisture, marine heat waves, sea level, and the physical background against which storms operate. [1][10]
That distinction matters. Climate change is not always the single cause of an event; it is often the loaded setting that makes some outcomes more likely, more intense, or more costly.
Put plainly, this is where the large system becomes readable. The policy language, engineering vocabulary, scientific measurement, and market signals all matter, but the test is more ordinary: whether people can see the risk early enough to make a better decision before the failure becomes personal.
The public wants yes-or-no attribution because disasters demand moral clarity. Science often answers with probability, intensity, and contribution, which can sound softer than it is. [7][11]
A family facing a flooded living room does not care whether the ocean supplied exactly this many percent of the rain. The water on the floor is the proof that background conditions matter.
The everyday stakes are the reason the receipts matter. A source note can look small at the bottom of a page, but each one is a handhold for the reader: a way to separate what the story knows from what it argues, what has been measured from what still has to be judged.
The better question is not whether the ocean wrote the whole storm. It is how much extra ink warm water gave the storm to write with.
Fisheries feel the heat before dinner does
Marine heat does not stay politely inside graphs. It moves through plankton blooms, fish migration, oxygen levels, disease pressure, shellfish stress, and the timing of work for people who fish for a living.
The IPCC ocean assessment and international ocean reports describe changes in marine ecosystems, while NOAA's climate material explains how ocean heat affects the physical environment that species depend on. [7][1]
The dinner plate is the last page of a long story. Before a price changes in a market, something already changed in spawning, distribution, fuel use, quota planning, or the distance a boat had to travel.
Put plainly, this is where the large system becomes readable. The policy language, engineering vocabulary, scientific measurement, and market signals all matter, but the test is more ordinary: whether people can see the risk early enough to make a better decision before the failure becomes personal.
Some species may move into new waters while others decline, which makes the politics complicated. A gain for one port can be a crisis for another. [9][10]
Try the thermometer test
If a single hot day does not define climate, a single cool day does not erase it. Ocean heat content matters because the ocean stores the long memory of the energy imbalance, smoothing the noise that can distract us at the surface.
Fishing communities know that a map of species is also a map of identity. When the fish move, the paperwork follows, but the memory of the old grounds does not move as easily.
The everyday stakes are the reason the receipts matter. A source note can look small at the bottom of a page, but each one is a handhold for the reader: a way to separate what the story knows from what it argues, what has been measured from what still has to be judged.
The ocean's fever will force fisheries management to become more flexible without becoming careless, and that is a harder assignment than simply drawing new lines.
Sea level is ocean heat with a long memory
Sea level is often described as water rising, but part of the story is water expanding. Heat makes seawater take up more space, while land ice loss adds more water to the system.
NASA's sea-level work, WMO reporting, NASA ocean-warming indicators, and IPCC assessment material connect thermal expansion, ice loss, coastal risk, and long-term change. [11][7]
The result is a delayed consequence. Even if emissions slowed sharply, some ocean and ice responses would keep unfolding because the system has already stored heat.
Put plainly, this is where the large system becomes readable. The policy language, engineering vocabulary, scientific measurement, and market signals all matter, but the test is more ordinary: whether people can see the risk early enough to make a better decision before the failure becomes personal.
That delay can make action feel unrewarding. Coastal adaptation is expensive now, while the avoided damage is partly measured in future disasters that do not happen. [1][6]
For a mayor, the problem can be a road that floods on sunny days. For a homeowner, it can be a mortgage term longer than the protective life of a seawall.
The everyday stakes are the reason the receipts matter. A source note can look small at the bottom of a page, but each one is a handhold for the reader: a way to separate what the story knows from what it argues, what has been measured from what still has to be judged.
Sea level teaches the same lesson as ocean heat: the slow part of climate can still be urgent if the infrastructure in its path was built for a different ocean.
Marine heat waves are changing the weather underwater
A heat wave at sea sounds abstract until it kills kelp, stresses coral, scatters fish, or helps set up a season of strange coastal weather. The water has its own extreme events.
Copernicus records, NOAA ocean explainers, Coral Reef Watch, and reef-monitoring sources show that marine heat can be monitored as a recurring pattern, not an anecdote. [2][10]
That makes the phrase marine heat wave important. It gives the ocean version of extreme heat a public name and a measurable shape.
Put plainly, this is where the large system becomes readable. The policy language, engineering vocabulary, scientific measurement, and market signals all matter, but the test is more ordinary: whether people can see the risk early enough to make a better decision before the failure becomes personal.
The hard part is that underwater extremes do not always produce immediate images. There may be no viral clip when a kelp forest begins to fail. [4][8]
Divers, fishers, surfers, island communities, and reef guides notice when the water feels off, but the instruments show whether that local feeling belongs to a larger pattern.
The everyday stakes are the reason the receipts matter. A source note can look small at the bottom of a page, but each one is a handhold for the reader: a way to separate what the story knows from what it argues, what has been measured from what still has to be judged.
As marine heat waves become more visible in data, the public may finally learn to treat ocean weather as part of climate news, not scenery behind it.
What the fever asks of us
The ocean has carried human excess with astonishing patience. That patience has sometimes made the problem look smaller than it is, because the heat disappeared from the air and entered the water.
The major observing and assessment sources agree on the direction of travel: the ocean is warming, the signs are measurable, and the consequences reach from reefs to coasts to weather systems. [1][7]
The story is not only catastrophe. It is also a triumph of measurement. Humanity built a way to hear the ocean more clearly just as the message became harder to avoid.
Put plainly, this is where the large system becomes readable. The policy language, engineering vocabulary, scientific measurement, and market signals all matter, but the test is more ordinary: whether people can see the risk early enough to make a better decision before the failure becomes personal.
Measurement, however, is not treatment. A fever chart is useful because it tells you the patient is sick; it does not lower the temperature by itself. [9][5]
Readers do not need to become oceanographers to understand the stakes. They only need to know that the blue part of the map is not empty. It is absorbing the heat of our choices.
The everyday stakes are the reason the receipts matter. A source note can look small at the bottom of a page, but each one is a handhold for the reader: a way to separate what the story knows from what it argues, what has been measured from what still has to be judged.
The ocean's fever asks for two kinds of seriousness: cut the heat going in, and prepare for the heat already stored.
Source notes
Climate-agency reports, ocean observing systems, coral-reef monitoring, and assessment reports used to check the ocean-heat claims in this story.
- World Meteorological Organization, State of the Global Climate 2024. Used for record ocean heat and global climate context.
- Copernicus Climate Change Service, Global Climate Highlights 2024. Used for recent global climate and sea-surface temperature context.
- NOAA, NOAA confirms fourth global coral bleaching event. Used to describe the global coral bleaching event.
- NOAA Coral Reef Watch, Coral Reef Watch. Used for the monitoring architecture behind reef alerts.
- Argo, Global Ocean Observing System. Used to explain subsurface ocean observation.
- NASA, Vital Signs: Ocean Warming. Used for the basic physics of ocean heat storage.
- IPCC, Special Report on the Ocean and Cryosphere in a Changing Climate. Used for assessed science on ocean and cryosphere changes.
- Global Coral Reef Monitoring Network, Status of Coral Reefs of the World. Used for long-run coral reef status and monitoring context.
- UNESCO IOC, State of the Ocean Report. Used for the observing-system frame.
- NOAA, Marine Heatwaves. Used for accessible explanation of ocean heat content.
- NASA Sea Level Change Team, Sea Level Change. Used for sea-level context tied to ocean warming.
Related reading

Science • Investigation
Wildlife for Sale
The trade begins with capture and ends with desire. In between are airports, ports, forged permits, encrypted chats, online listings, weak laws, and animals treated as cargo with a heartbeat.
By Mira Sato • May 20, 2026 • 9:00 a.m. EDT

Science • Report
Artemis II Proved the Moon Is an Engineering Project Again
The launch mattered, but the deeper achievement was operational: human-rated hardware, multinational systems, and a lunar mission that generated evidence rather than nostalgia.
By Mira Sato • April 7, 2026 • 6:55 a.m. EDT

World • Investigation
Cartels Beneath the State
A source-forward investigation into how modern cartels recruit labor, tax local economies, launder money, exploit global demand, corrupt institutions, and govern by fear beneath the state.
By Samir Haddad • June 8, 2026 • 9:00 a.m. EDT