Article Gallery


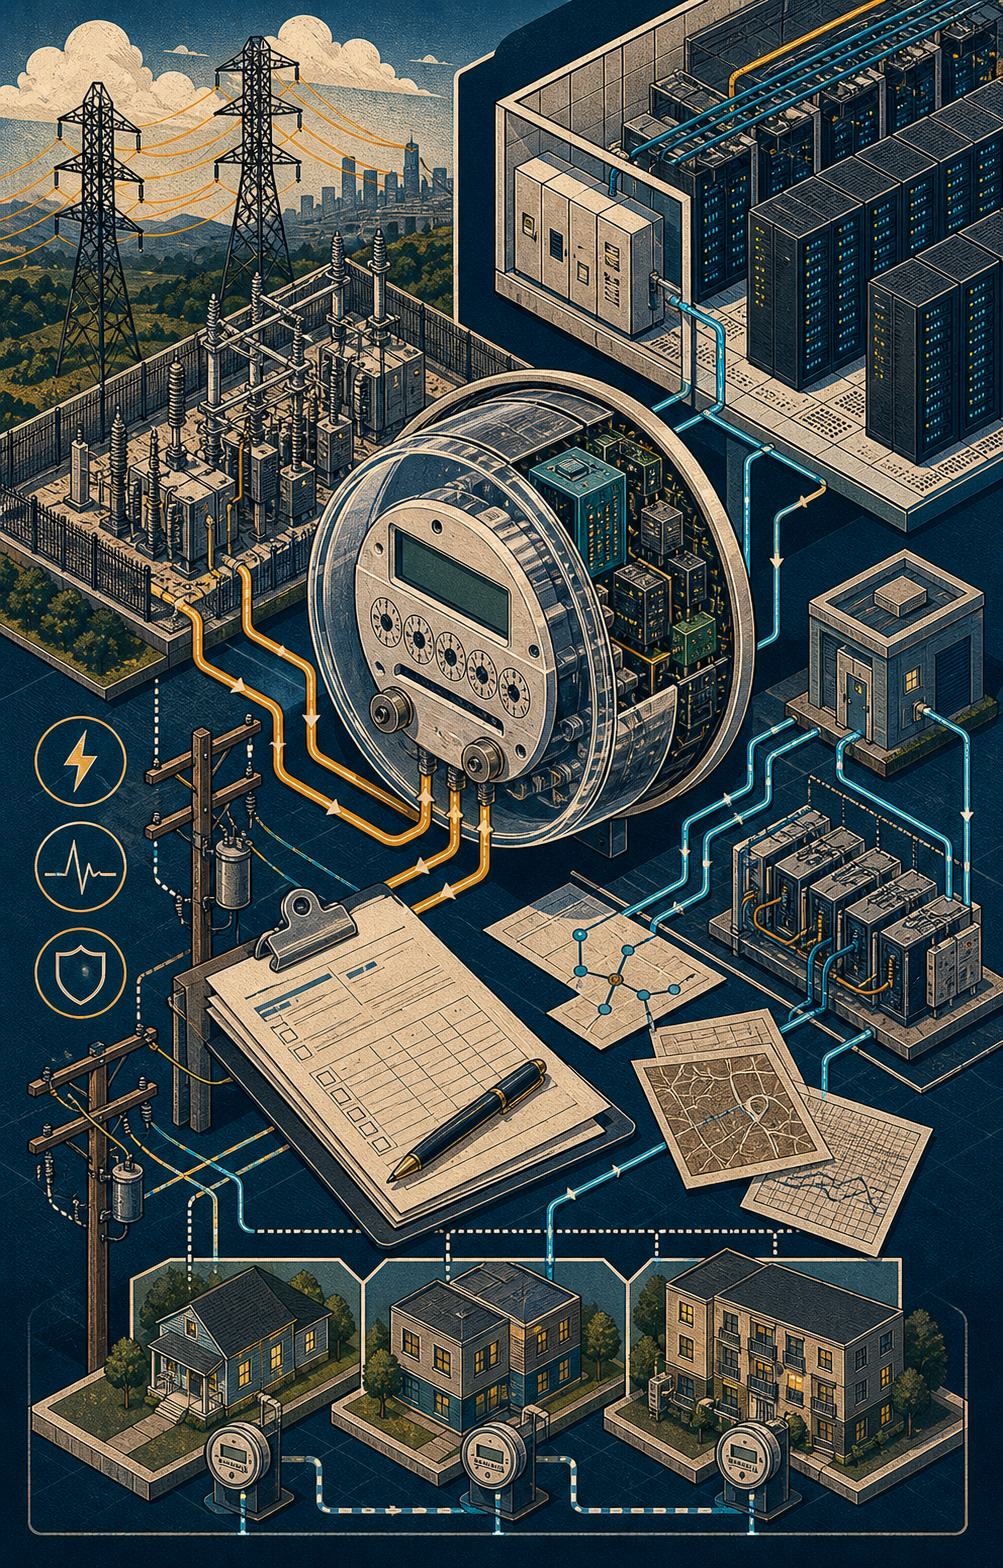
The load has meter readings
The software story now has an electrical signature: EIA said on Jan. 13, 2026 that U.S. electricity demand was headed for its strongest four-year growth since 2000, with large computing facilities including data centers named as a driver.[10] EIA then launched a pilot survey on March 25, 2026 to measure data-center energy use in Texas, Washington, Northern Virginia, and Washington, D.C., which is a quiet admission that older national measurement tools were not built for this scale or speed.[16]
The IEA's special report is blunt about why the measurement problem matters: it says a typical AI-focused data center can consume as much electricity as 100,000 households, while the largest under construction can consume 20 times that much.[26][27] EPRI's 2026 scenarios put U.S. data-center electricity use at roughly 177 to 192 TWh in 2024 and 380 to 790 TWh by 2030, depending on buildout and assumptions.[62][64] Lawrence Berkeley National Laboratory estimated 176 TWh in 2023 and projected 325 to 580 TWh by 2028, so the reputable forecasts disagree on the top of the range but not on the direction of travel.[66]
My read from those numbers is narrow and practical: the question is not whether AI is good or bad, and not whether every announced campus will actually be built. The question is whether public utility systems, which were designed to plan slowly and socialize many costs across broad customer classes, can absorb private loads that arrive in city-sized blocks before regulators have fully priced, measured, or locally negotiated them.[42][62][69]
The public argument often tries to settle the issue with a single adjective: clean, wasteful, strategic, reckless, subsidized, or necessary. The documents point to a narrower sentence: data centers are now large enough that the accounting choices around them can matter almost as much as the engineering choices.[37][42][62][83]
The denominator changes the debate
EIA's Electric Power Annual says U.S. retail electricity sales were 3,975.4 TWh in 2024, and total end use, including direct use, was 4,110.4 TWh.[1][2] Commercial-sector sales were 1,450.9 TWh and residential sales were 1,482.9 TWh, so data-center demand belongs in a commercial-load concentration debate as much as a national-share debate.[1][5]
The Press calculation is simple: compare EPRI's 177 to 192 TWh 2024 data-center range with EIA's 2024 retail-sales denominator. That range equals 4.5% to 4.8% of all U.S. retail sales, but it equals 12.2% to 13.2% of today's commercial-sector sales.[1][62][64]
Using the same denominator, EPRI's 380 to 790 TWh 2030 range equals 9.6% to 19.9% of 2024 U.S. retail sales and 26.2% to 54.4% of 2024 commercial sales.[1][62][64] That comparison is not a claim that the 2030 grid will stay the size of the 2024 grid. It is a scale check: if the denominator has to grow fast, someone must build, permit, finance, and rate-base that growth.
of 2024 U.S. retail electricity sales, using EIA Electric Power Annual sales as the denominator.
of 2024 U.S. retail sales if compared against today's grid size; a scale check, not a frozen-grid forecast.
per year, before transmission losses and before asking which local grid absorbs the load.
of Virginia's 2024 all-sector sales for one 1 GW load running at 95% utilization.
LBNL's 2023 estimate lands in the same neighborhood from a different method: 176 TWh was 4.5% of 2023 U.S. retail sales and 12.5% of commercial-sector sales in The Press calculation using EIA's 2023 annual table.[1][66] Its 2028 projection range of 325 to 580 TWh would equal 8.4% to 15.0% of 2023 retail sales if compared against that historical denominator.[66] That scale helps explain why utility planners are treating the issue as a system problem rather than a single-industry footnote.[78]
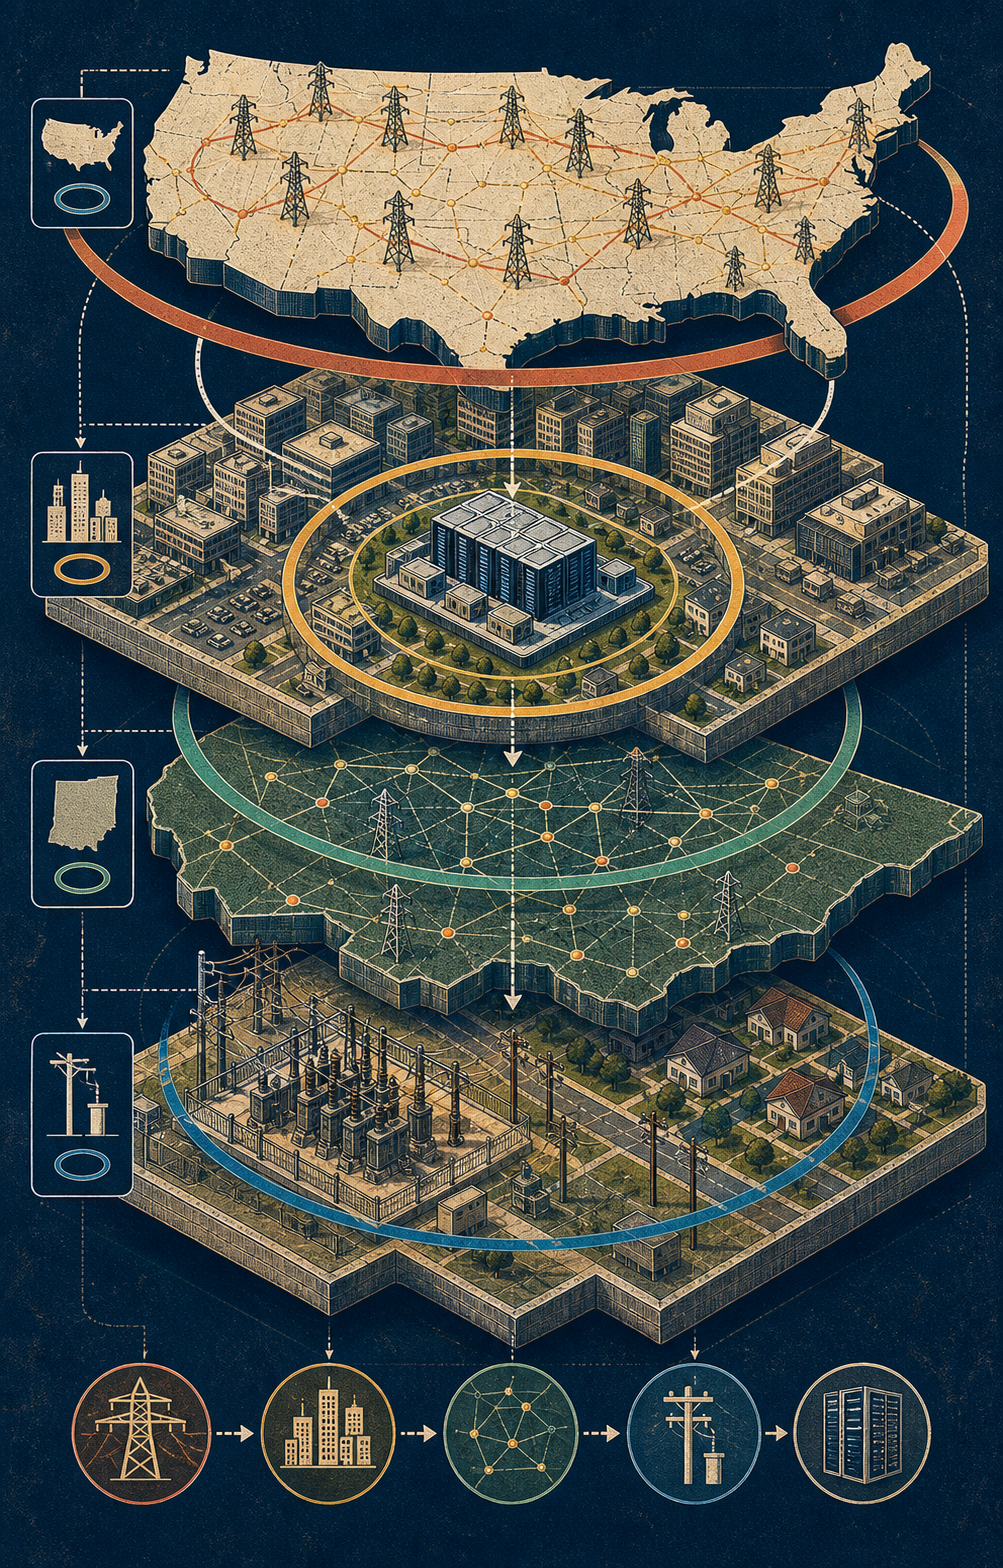
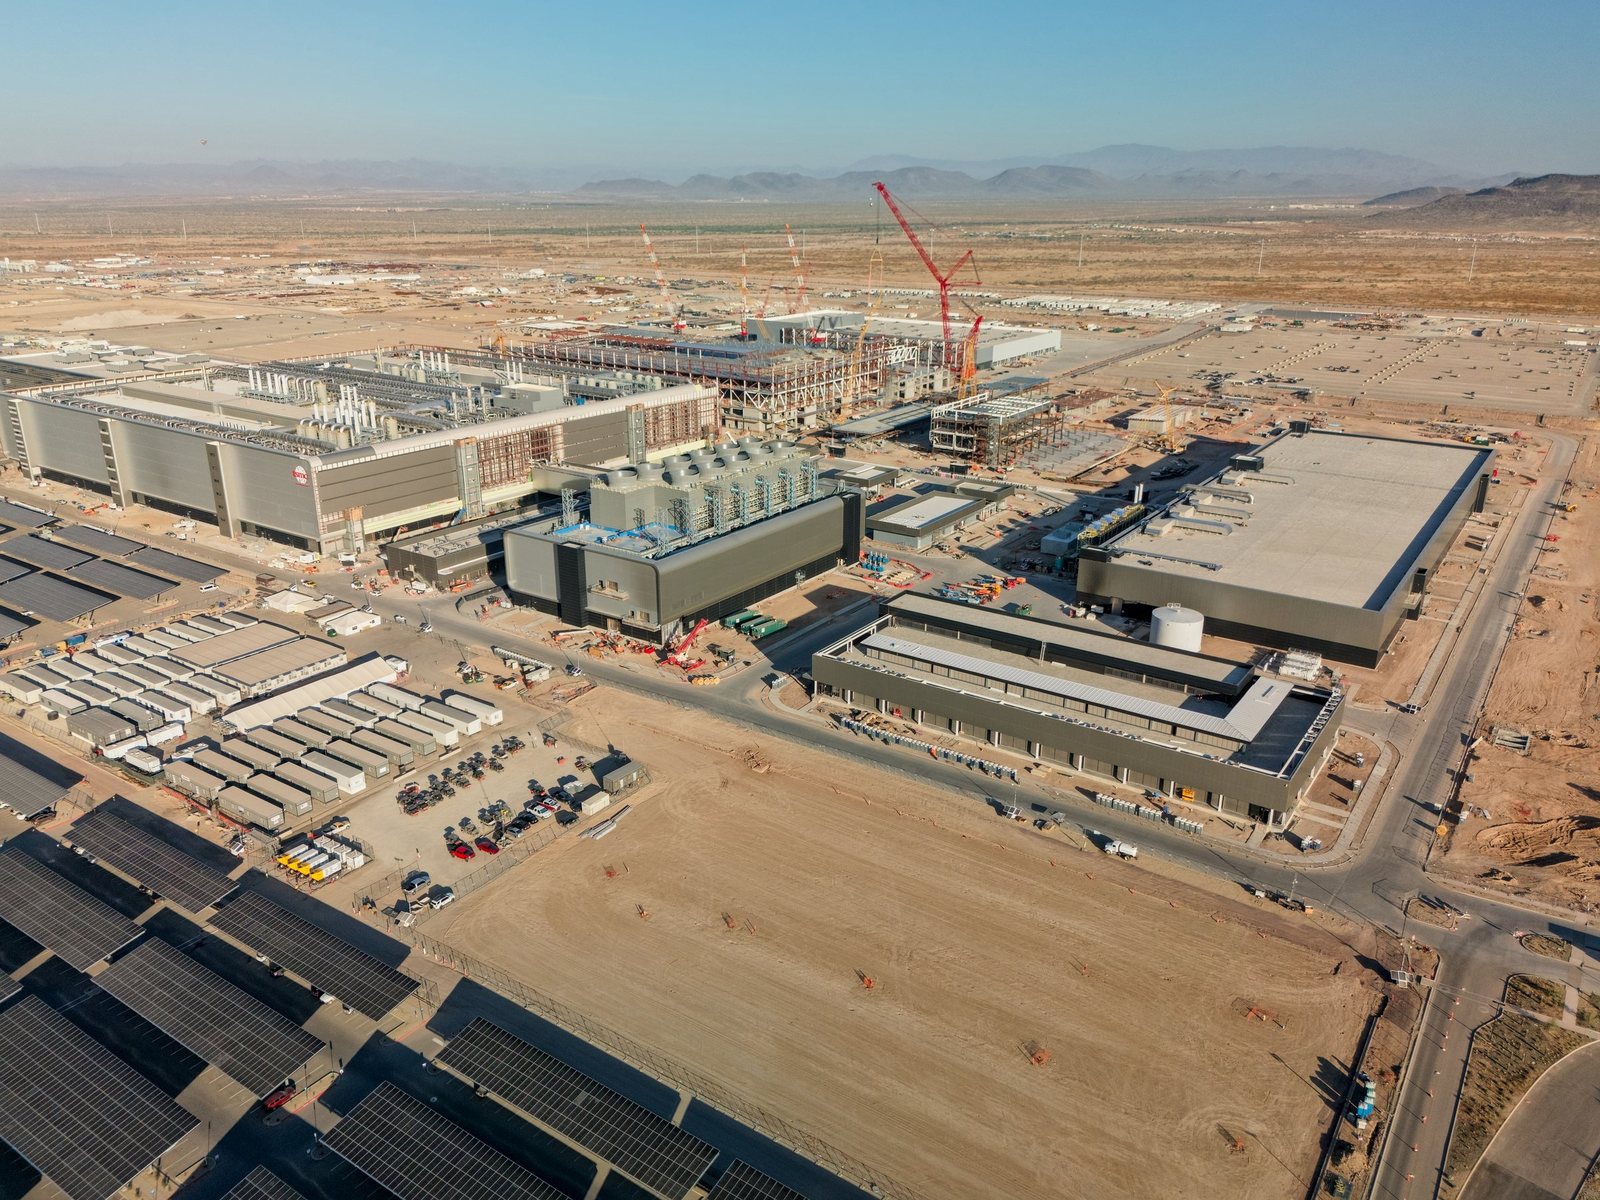
One gigawatt is a small city inside one fence
A 1 GW load running at 95% utilization uses about 8.3 TWh per year: 1,000 MW times 8,760 hours times 0.95. That arithmetic is not a forecast, but it is a useful smell test for project announcements, because it turns a headline megawatt number into annual energy that can be compared with state electricity sales.[3][4]
In Virginia, EIA's 2024 all-sector retail sales were 138.0 TWh, so one 1 GW load at 95% utilization equals about 6.0% of statewide annual sales; a hypothetical 10 GW campus at the same utilization equals about 60.3%.[3][4] In Texas, the same 1 GW load equals about 1.6% of 2024 all-sector sales because Texas sold 505.4 TWh, but even there a 10 GW load equals about 16.5% of annual sales.[3][76]
The same calculation looks sharper in smaller or fast-growing states. One 1 GW load at 95% utilization equals about 5.5% of Georgia's 2024 all-sector sales, 5.4% of Ohio's, 6.2% of Illinois's, 13.9% of Oregon's, 15.2% of Iowa's, and 23.6% of Nebraska's.[3][4] That is why national percentages can understate the local fight: a load that looks manageable on a U.S. chart can be enormous at a substation, county, balancing area, or rate case.
That state math also explains why the industry's favorite abstraction, 'the cloud,' is so politically unhelpful. A cloud service can serve users everywhere, but the power draw is attached to a place, the transmission upgrade is attached to a place, the cooling question is attached to a place, and the local tax bargain is attached to a place.[81][82][86]
Virginia is the warning label
Virginia is the cleanest case study because it is both a success story and a warning. JLARC says Virginia's data-center industry benefited from a strong fiber network, reliable cheap energy, available land, proximity to major national customers, and a state data-center tax incentive.[81][82][86] That list is not incidental; it is the recipe that other states are now trying to copy.
JLARC also found that data centers provide positive economic benefits mostly through capital investment and construction activity, not because they produce large permanent workforces like a labor-intensive factory.[81][82] That distinction matters for local politics: construction cranes are visible, tax-base effects can be real, but the long-run operating footprint may be mostly land, equipment, utility infrastructure, and a small staff relative to the load.
The most important JLARC number is a household-bill warning, not a data-center marketing number. Its report says a typical Dominion Energy residential customer could face generation- and transmission-related costs rising by an estimated $14 to $37 per month in real dollars by 2040, independent of inflation.[81][82] It also names separate data-center customer classes, cost-allocation changes, and more frequent utility-rate adjustments as tools that could help insulate other customers.[81][82]
That is why I would be careful with the slogan that data centers 'raise bills.' Weather, fuel prices, grid hardening, aging infrastructure, generation mix, storm recovery, and ordinary rate-case decisions all matter.[8][14][15][68] The more defensible claim is narrower: if data-center-driven infrastructure costs are not assigned carefully, household and small-business customers can be exposed to costs they did not cause and cannot control.[42][69][71][72]
Grid operators are learning to count promises
PJM's 2026 forecast process shows why counting load is hard. PJM said its updated forecast lowered near-term peak-demand expectations through 2032 partly because it improved the vetting of requested adjustments for data centers and large loads.[71] The point is not that the boom disappeared; planners are trying to separate real load from speculative requests, duplicate queues, early-stage site control, and wishful project timing.
PJM's board also outlined plans to integrate large loads reliably while preserving affordability, and its load-forecast materials now treat data centers and other large loads as a planning issue rather than a generic commercial category.[70][73][74][75] The fact that the country's largest grid operator needs special procedures for the category is itself evidence that the old categories are wearing thin.
ERCOT's 2026 preliminary long-term load forecast draws the same lesson from Texas. ERCOT says it is collecting information through transmission and distribution utilities that work directly with medium loads of 25 MW to 74.9 MW and large loads of 75 MW and above, including data centers, cryptocurrency mining, industrial load, and oil-and-gas processes.[76] Its 2025 constraints-and-needs report puts large-load growth inside the same planning world as transmission constraints, resource additions, and reliability obligations.[77]
NERC's reliability work adds the risk frame: large loads create forecasting, modeling, interconnection, and operational questions that do not fit neatly into yesterday's demand-growth assumptions.[78][79][80] My conclusion from PJM, ERCOT, and NERC is not that data centers are uniquely impossible to serve. It is that the electric system needs better proof of project maturity before it builds public infrastructure around private announcements.
Rate design is infrastructure politics in numbers
FERC's RM26-4 large-load docket puts the technical problem into regulatory language: how should very large loads interconnect to the transmission system without damaging reliability, delaying other customers, or shifting costs to people who did not create the demand?[83][84] Commissioner Judy Chang's testimony framed the same consumer-protection concern in plain terms, warning against leaving families and small businesses to pay for upgrades needed by large customers.[69]
DOE and LBNL have both treated large-load rate design as an active policy problem, and LBNL's work points toward evolving practices such as clearer tariffs, minimum payment obligations, contract terms, and cost-allocation structures for customers whose arrival can force large network investments.[42][71][72] Those tools sound dry until a project is delayed, downsized, or canceled after a utility has already planned around it.
The basic accounting question is simple: if a data center requires a new substation, transmission upgrade, generation resource, or standby arrangement, which dollars are assigned to the developer and which dollars are spread across the rate base?[42][69][71] If the answer is hidden inside confidential contracts or slow rate cases, the public may not know whether it is buying grid capacity for itself or underwriting a private compute campus.
The Brattle Group's flexibility argument is the best pro-growth counterweight: better use of existing grid capacity could reduce consumer costs and speed interconnection if customers can shape or shift load instead of demanding firm service at every hour.[87][88] That is a real opening, but it should be proven through tariffs, metering, performance rules, and penalties rather than accepted as a sales pitch.
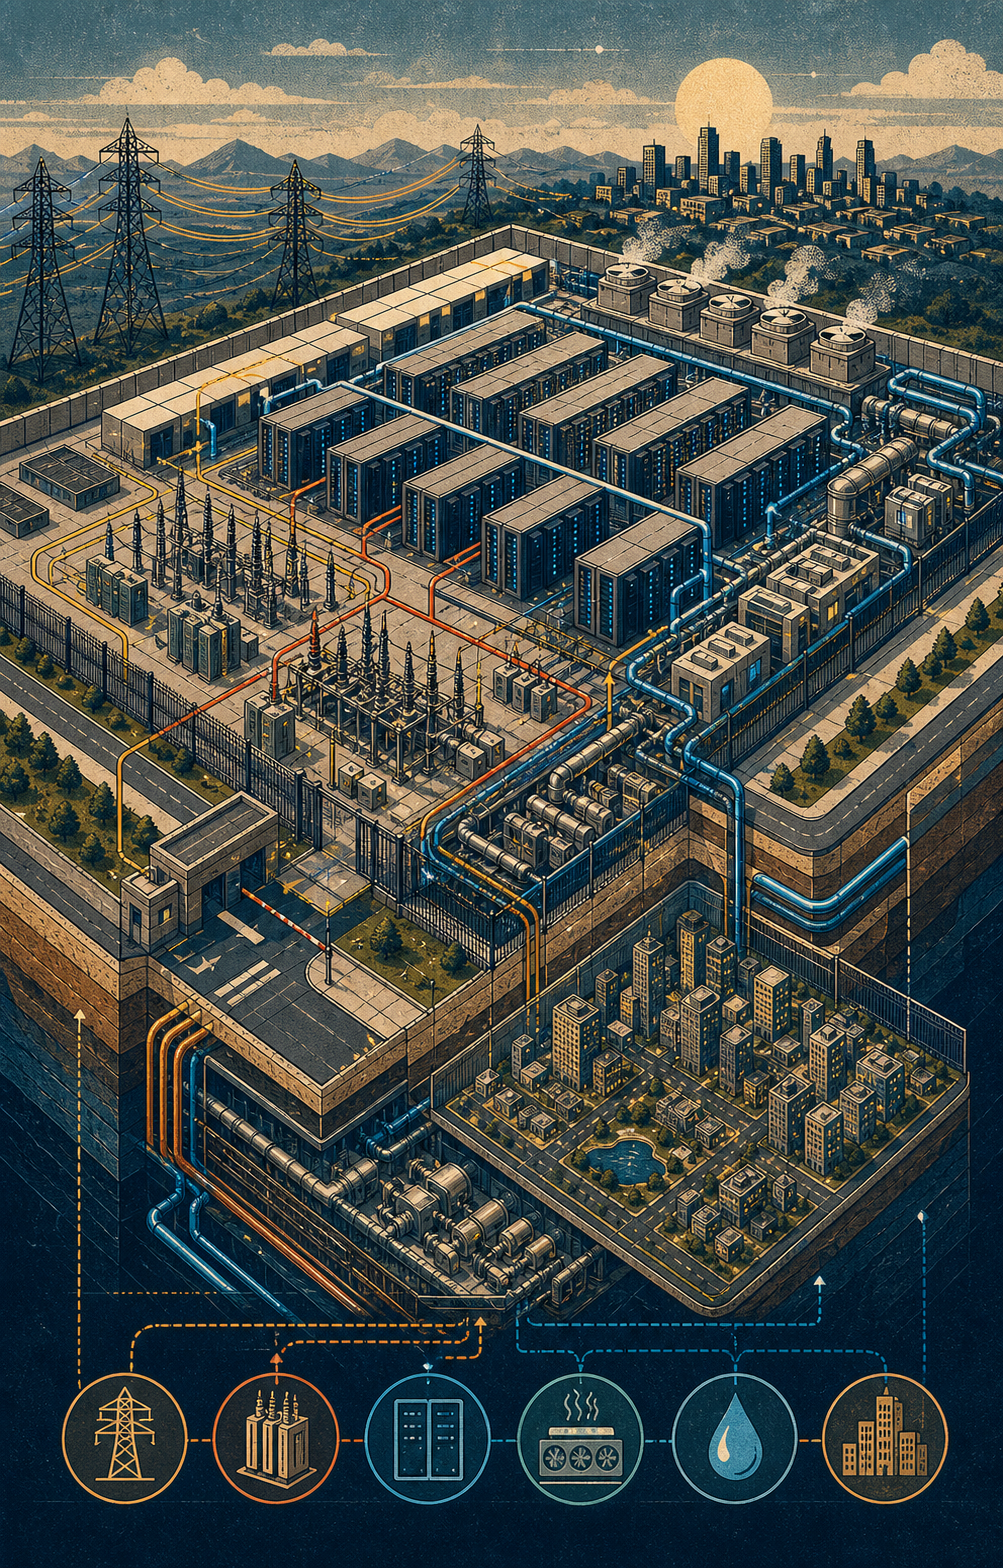
Power supply has moved into cloud strategy
DOE's data-center work now sits beside geothermal, nuclear, transmission, efficiency, and clean-energy-resource materials because serving AI load is not a single-resource problem.[39][41][44][45][52][54] IEA's supply chapter reaches a similar conclusion: renewables, natural gas, nuclear, storage, grids, and efficiency all matter, but their relevance depends on local resource mix, timing, permitting, and reliability needs.[28][30][33]
That is why on-site generation keeps appearing in project discussions. A campus that can bring power with it may reduce pressure on existing customers, but only if the arrangement also accounts for emissions, backup, interconnection, water, fuel delivery, market impacts, and what happens when the facility still needs the grid.[41][49][50][51]
Transmission is the slowest part of the romance. DOE's SPARK initiative, transmission-tool work, and permitting recommendations all point to the same non-glamorous constraint: lines, reconductoring, siting, and interconnection studies take institutional time even when capital is available.[54][59][60] AI can order chips faster than the public can build a high-voltage corridor.
The cleaner way to say it is this: the AI industry is learning that it cannot buy electricity the way it buys cloud regions. Electricity is an obligation system. It has reliability standards, shared costs, planning horizons, land-use fights, and physical bottlenecks that do not move at product-launch speed.[78][83][84]
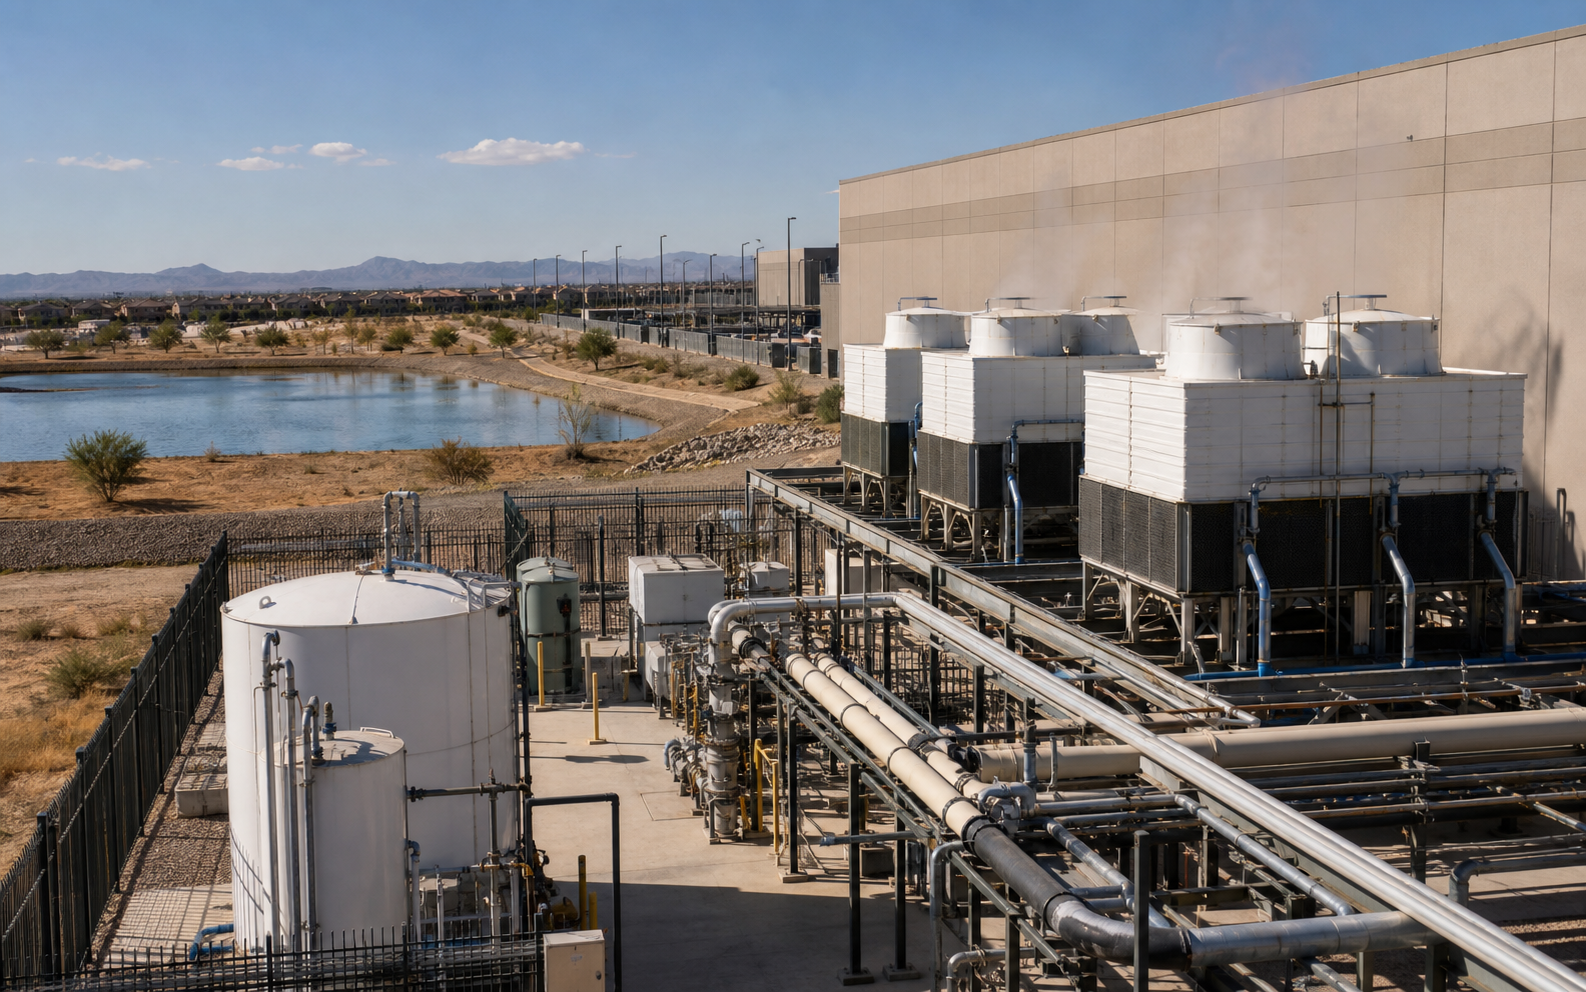
Water turns a national boom into a local argument
Water is not the same problem everywhere. Google, Microsoft, Amazon, and Meta all publish sustainability materials that discuss data-center efficiency, water stewardship, energy procurement, and operational metrics, but those reports do not make water risk disappear at the local level.[89][90][91][92][93] The same cooling design can feel routine in one watershed and politically explosive in another.
JLARC's Virginia review is more nuanced than the loudest public debate: it says data-center water use is currently sustainable in Virginia, but growing.[81][82] It also says most data centers use about the same amount of water or less than an average large office building, while a few require substantially more and some require less than a typical household.[81][82] That finding argues against panic, but it also argues for measurement.
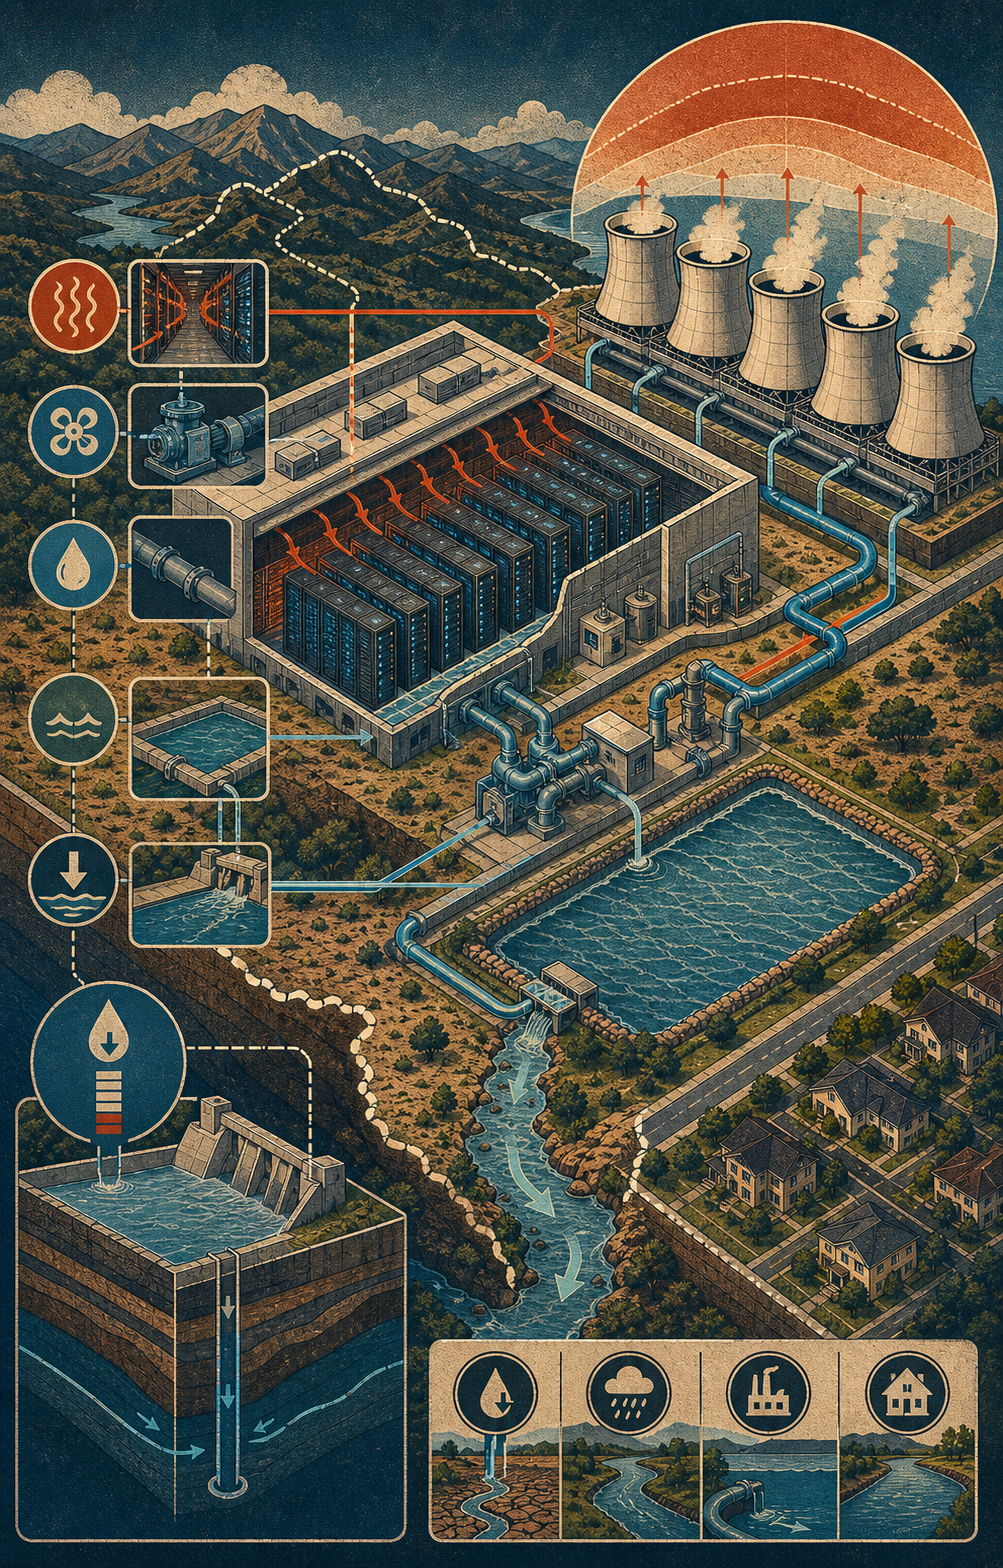
My cautious read: water should not be used as a universal veto, because the facts differ by facility, climate, cooling system, and supply source. It should be used as a disclosure requirement, because the public cannot evaluate a project from a tax-abatement memo if the cooling design, annual withdrawals, consumptive use, and drought contingencies are vague.[81][82][90][92][93]
Cloud firms are infrastructure buyers
The largest cloud and AI firms have moved beyond servers into power, land, chips, cooling systems, grid access, and political patience. Company sustainability reports from Google, Microsoft, Amazon, and Meta describe efficiency gains and energy or water programs, but they also show the physical ledger behind compute growth: energy, water, land, hardware, and local infrastructure.[89][90][91][92][93]
That corporate ledger should be read beside public records, not instead of them. A company can improve power-usage effectiveness, sign clean-energy contracts, and invest in water replenishment while still placing a large load on a constrained local grid or asking a utility to plan around growth projections that might change.[70][76][82][89]

Selected AP reporting shows the social-license side of that shift: communities have increasingly challenged data-center projects, and Microsoft has publicly argued that Big Tech should pay its way for AI data centers.[94][95][96] State fights over tax breaks, capacity additions, and local pollution concerns have moved the issue into ordinary politics.[98][103][105]
The best version of the industry case is not that data centers have no costs. It is that the costs can be made transparent, assigned properly, and paired with new resources that leave the grid stronger. The worst version of the industry case is that speed alone should excuse weak disclosure, speculative load queues, or cross-subsidies hidden inside utility planning.[42][69][87][88]
The local record is messy because the projects are different
News examples are useful only if they are not mistaken for a universal rule. Maine's moratorium debate, Georgia's capacity expansion, Virginia's tax-break fight, Memphis-area pollution concerns around xAI, Microsoft taking over a Texas expansion, and Ohio's 10 GW proposal all describe different mixes of electricity, land, water, tax policy, fuel, and local consent.[96][98][103][104][105][108][109]
That variety is why I do not think the right national answer is a blanket yes or a blanket no. A data center attached to new firm power, transparent water reporting, full-cost grid upgrades, and enforceable flexibility is not the same civic bargain as a speculative campus asking a utility to reserve scarce capacity while the public sees only the tax-base upside.[49][50][51][76][87]
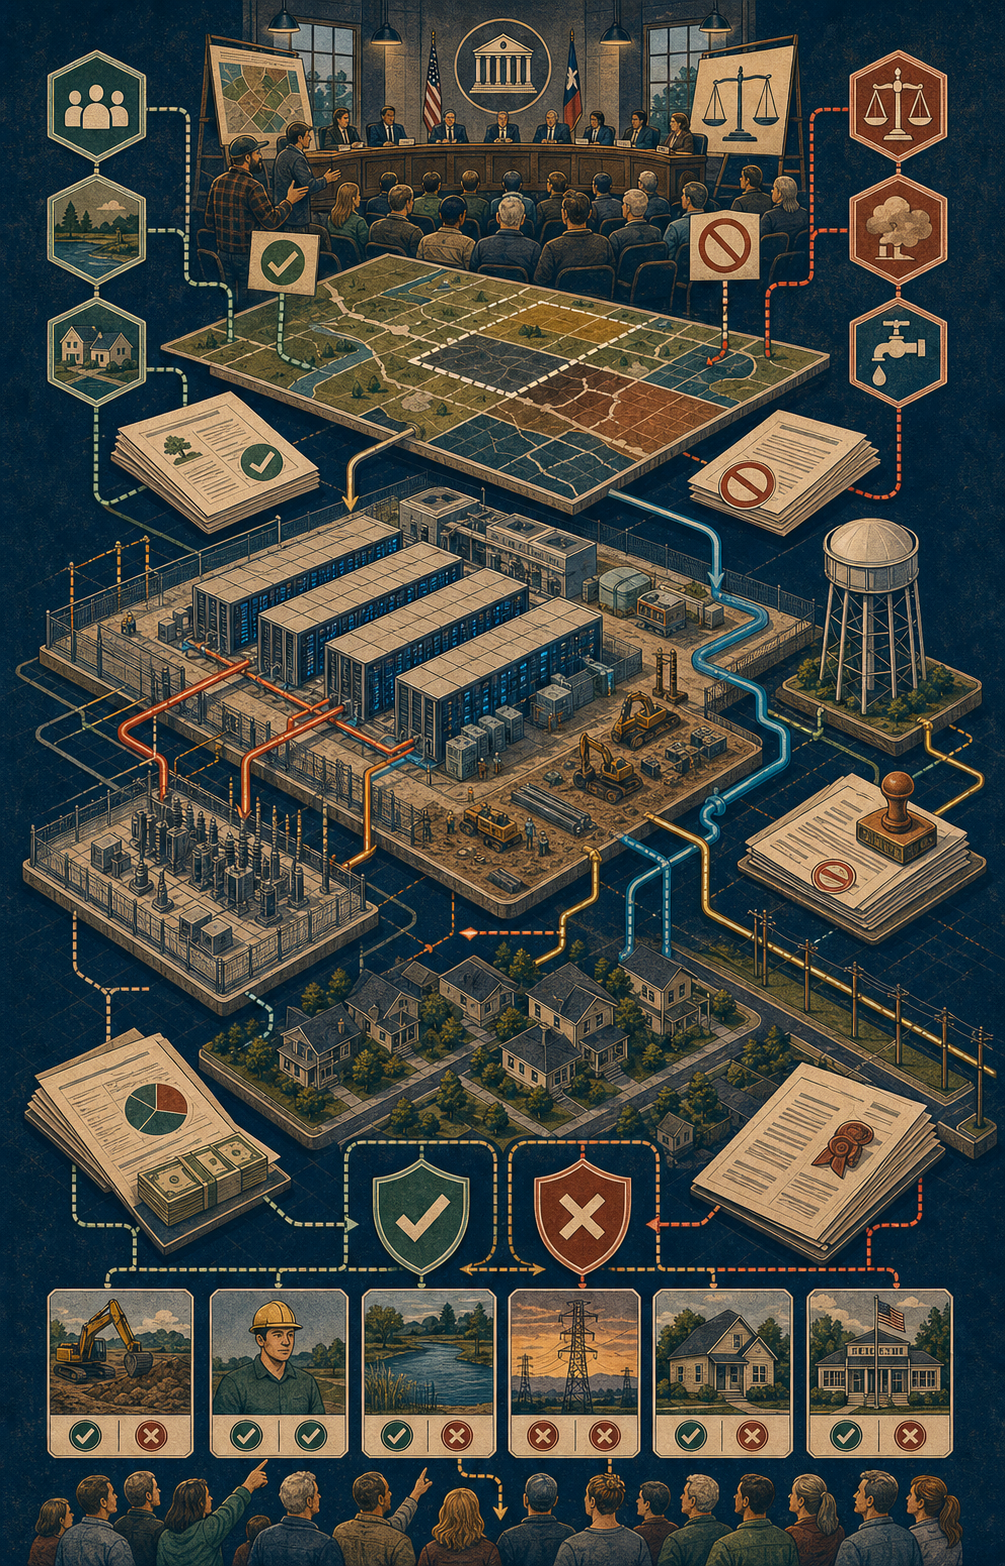
The harder conclusion is that America probably needs more compute and stricter gatekeeping at the same time. More compute without gatekeeping risks hidden transfer payments and local backlash. Gatekeeping without a build path risks pushing strategic infrastructure into less transparent places or slower jurisdictions.[26][37][83][84][88]
That balance is less satisfying than a slogan, but it matches the evidence better. The data-center question is not whether the future should use electricity. The question is whether each project can show enough numbers, contracts, flexibility, and local safeguards to deserve the electricity it wants.[1][42][62][69][81]
What discipline would look like
A disciplined data-center policy would start with measurement. EIA's pilot survey should become a durable public statistical program that can distinguish existing load, committed load, speculative load, cooling technology, customer class, geography, and timing without exposing legitimate security details.[16] Without that denominator, every rate case is forced to work partly in fog.
Second, large-load tariffs should force more of the project-specific cost onto the project-specific customer. That means minimum bills, collateral, exit charges, construction contributions, or other mechanisms strong enough to protect other customers if a proposed campus changes size after the grid has already planned around it.[42][69][71][72]
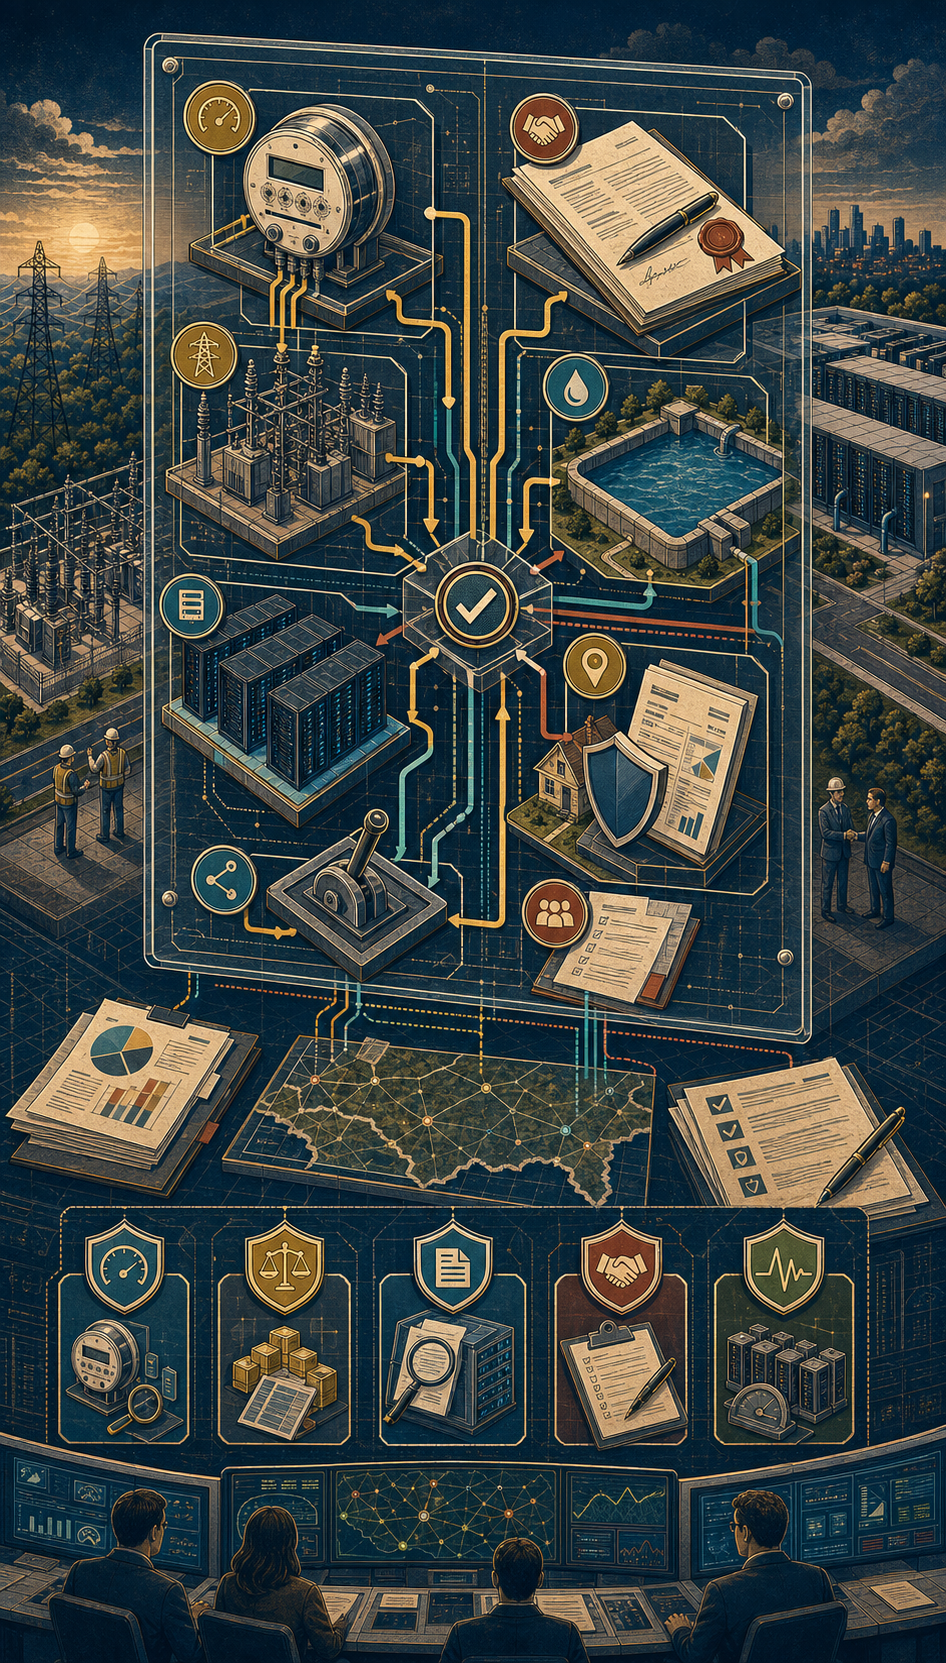
Third, flexibility should be rewarded only when it is operationally real. A customer that can curtail, shift non-urgent workloads, use on-site storage, or coordinate with grid conditions deserves a different interconnection conversation than a customer demanding 24/7 firm service with no meaningful operating flexibility.[65][87][88]
Fourth, local disclosure should treat water, backup generation, noise, tax incentives, and land use as part of the same bargain as electricity. A project that is nationally valuable can still be locally sloppy; a project that is locally attractive can still be nationally inefficient if it locks in expensive or high-emission supply in the wrong place.[41][81][82][90][92]
My bottom line is deliberately less dramatic than the politics around the issue. Data centers are more than warehouses with servers, and they are not automatically civic villains. They are private industrial loads arriving inside public utility systems, and the public should demand the ordinary virtues that make infrastructure legitimate: measurement, pricing, disclosure, enforceable contracts, and a fair answer to the bill.[16][42][69][83][84]
Source notes
The article uses 110 public source links. The stack favors official statistics, government records, grid-operator documents, national-lab work, company reports, regulatory filings, and selected local reporting.
- 1. U.S. Energy Information Administration, EIA Electric Power Annual Table 2.2 workbook.
- 2. U.S. Energy Information Administration, EIA Electric Power Annual Table 2.2.
- 3. U.S. Energy Information Administration, EIA Electric Power Annual Table 2.8 workbook.
- 4. U.S. Energy Information Administration, EIA Electric Power Annual Table 2.8.
- 5. U.S. Energy Information Administration, EIA Electric Power Annual Table 2.4 workbook.
- 6. U.S. Energy Information Administration, EIA Electric Power Annual Table 2.4.
- 7. U.S. Energy Information Administration, EIA monthly sales and revenue workbook.
- 8. U.S. Energy Information Administration, EIA Short-Term Energy Outlook.
- 9. U.S. Energy Information Administration, EIA Annual Energy Outlook.
- 10. U.S. Energy Information Administration, EIA Jan. 13, 2026 press release.
- 11. U.S. Energy Information Administration, EIA Annual Energy Outlook 2026 narrative.
- 12. U.S. Energy Information Administration, EIA Short-Term Energy Outlook, Jan. 2026.
- 13. U.S. Energy Information Administration, EIA Electricity Explained.
- 14. U.S. Energy Information Administration, EIA STEO electricity, coal and renewables outlook.
- 15. U.S. Energy Information Administration, EIA full Short-Term Energy Outlook PDF.
- 16. U.S. Energy Information Administration, EIA pilot data-center survey.
- 17. U.S. Energy Information Administration, EIA April 2026 STEO PDF.
- 18. U.S. Energy Information Administration, EIA AEO narrative page.
- 19. U.S. Energy Information Administration, EIA analysis hub.
- 20. U.S. Energy Information Administration, EIA: Annual Energy Outlook 2026.
- 21. U.S. Energy Information Administration, EIA residential utility disconnections analysis.
- 22. U.S. Energy Information Administration, EIA residential utility disconnections report PDF.
- 23. U.S. Energy Information Administration, EIA: U.S. electricity prices continue steady increase.
- 24. U.S. Energy Information Administration, EIA: fossil generation could rise with faster-than-expected data-center demand.
- 25. International Energy Agency, IEA Energy and AI.
- 26. International Energy Agency, IEA executive summary.
- 27. International Energy Agency, IEA energy demand from AI.
- 28. International Energy Agency, IEA energy supply for AI.
- 29. International Energy Agency, IEA key questions on energy and AI.
- 30. International Energy Agency, IEA AI and climate change.
- 31. International Energy Agency, demand global electricity use to grow strongly in 2025 and 2026.
- 32. International Energy Agency, IEA energy-AI nexus explainer.
- 33. International Energy Agency, IEA Electricity 2026 demand outlook.
- 34. International Energy Agency, IEA AI-energy observatory launch.
- 35. International Energy Agency, IEA conference report.
- 36. International Energy Agency, International Energy Agency, data-centre electricity use surged in 2025.
- 37. U.S. Department of Energy, DOE data center electricity demand report release.
- 38. U.S. Department of Energy, femp data centers fact sheet 2025.pdf.
- 39. U.S. Department of Energy, geothermal and data centers.
- 40. U.S. Department of Energy, data centers and servers.
- 41. U.S. Department of Energy, clean energy resources meet data center electricity demand.
- 42. U.S. Department of Energy, electricity rate designs large loads evolving practices and opportunities.
- 43. U.S. Department of Energy, DOE: advantages and challenges of nuclear-powered data centers.
- 44. U.S. Department of Energy, marvel microreactor project.
- 45. U.S. Department of Energy, oak ridge national laboratory and elementl power partner accelerate siting nuclear.
- 46. U.S. Department of Energy, NNSA seeks AI data-center and energy-project proposals at Savannah River Site.
- 47. U.S. Department of Energy, DOE seeks AI data-center and energy-project proposals at Oak Ridge.
- 48. U.S. Department of Energy, DOE identifies 16 federal sites for data-center and AI infrastructure development.
- 49. U.S. Department of Energy, DOE: site selection for AI data-center and energy infrastructure on federal lands.
- 50. U.S. Department of Energy, DOE fact sheet: affordable energy access in Ohio and AI power demand.
- 51. U.S. Department of Energy, DOE partnership to power America’s AI future.
- 52. U.S. Department of Energy, DOE announces $171.5 million to expand U.S. geothermal energy.
- 53. U.S. Department of Energy, DOE large-load ANOPR letter.
- 54. U.S. Department of Energy, DOE SPARK transmission initiative.
- 55. U.S. Department of Energy, DOE energy efficiency in data centers.
- 56. U.S. Department of Energy, DOE data-center efficiency event.
- 57. U.S. Department of Energy, DOE FEMP winter workshops.
- 58. U.S. Department of Energy, DOE LPO conditional commitment for PacifiCorp transmission expansion.
- 59. U.S. Department of Energy, DOE transmission tools article.
- 60. U.S. Department of Energy, DOE recommendations for powering AI and data-center infrastructure.
- 61. betterbuildingssolutioncenter.energy.gov, DOE Better Buildings: Data Centers sector page.
- 62. Electric Power Research Institute, EPRI Powering Intelligence executive summary.
- 63. Electric Power Research Institute, EPRI Powering Intelligence.
- 64. Electric Power Research Institute, EPRI Powering Intelligence 2026 FAQs.
- 65. Electric Power Research Institute, EPRI DCFlex homepage.
- 66. Lawrence Berkeley National Laboratory, Berkeley Lab report news release.
- 67. Oak Ridge National Laboratory, ORNL workshop on AI data center power.
- 68. Federal Energy Regulatory Commission, FERC State of the Market presentation PDF.
- 69. Federal Energy Regulatory Commission, FERC testimony by Judy W. Chang.
- 70. PJM Interconnection, PJM board large-load integration PDF.
- 71. PJM Interconnection, PJM updated 20-year forecast.
- 72. PJM Interconnection, PJM Inside Lines: 2025 planning review.
- 73. PJM Interconnection, PJM, Load Forecast Development Process.
- 74. PJM Interconnection, PJM, 2026 Load Forecast Report.
- 75. PJM Interconnection, PJM, 2026 Long-Term Load Forecast supplement.
- 76. ERCOT, ERCOT preliminary long-term load forecast.
- 77. ERCOT, ERCOT constraints and needs report.
- 78. North American Electric Reliability Corporation, NERC 2025-2026 Winter Reliability Assessment.
- 79. North American Electric Reliability Corporation, NERC Large Loads Task Force page.
- 80. North American Electric Reliability Corporation, NERC March 2026 white paper.
- 81. Virginia JLARC, JLARC Data Centers in Virginia landing page.
- 82. Virginia JLARC, JLARC Data Centers in Virginia PDF.
- 83. Virginia JLARC, JLARC presentation, Data Centers in Virginia.
- 84. Virginia Reports to the General Assembly, Virginia RD40 data center report PDF.
- 85. Virginia Reports to the General Assembly, Virginia Reports to the General Assembly, RD40 report page.
- 86. Virginia Economic Development Partnership, Virginia Economic Development Partnership, Data Center Retail Sales and Use Tax Exemption.
- 87. The Brattle Group, Brattle The Untapped Grid PDF.
- 88. The Brattle Group, Brattle press release on The Untapped Grid.
- 89. Google, Google data center efficiency.
- 90. Google, Google 2025 Environmental Report PDF.
- 91. Microsoft, Microsoft sustainability report.
- 92. Amazon, Amazon 2024 Sustainability Report PDF.
- 93. Meta, Meta 2024 Sustainability Report.
- 94. Associated Press, AP: communities increasingly defeat proposed data centers.
- 95. Associated Press, AP: Microsoft president says Big Tech should pay its way for AI data centers.
- 96. Associated Press, AP: Maine data-center moratorium and local backlash.
- 97. Associated Press, AP: data-center moratorium debate.
- 98. Associated Press, AP: Georgia regulators approve large utility capacity increase.
- 99. Associated Press, AP: data centers and U.S. power-grid pressure.
- 100. Associated Press, AP on the Georgia-Alabama power expansion loan.
- 101. Associated Press, AP on Georgia Power freezing base rates.
- 102. Associated Press, AP on Meta nuclear deals.
- 103. Associated Press, AP: Virginia data-center tax-break debate.
- 104. Associated Press, AP: xAI Mississippi data-center investment.
- 105. Associated Press, AP: pollution concerns around xAI in Memphis.
- 106. Associated Press, AP on Anthropic and Google chip deal.
- 107. Associated Press, AP on U.S. copyright office AI-assisted works report.
- 108. Associated Press, AP: Microsoft takes over Texas data-center expansion.
- 109. Associated Press, AP: Ohio 10-GW data-center project.
- 110. Associated Press, AP: fast-tracking power plants in the PJM region.
Related reading
Technology • Report
AI Needs Electricity, Steel, and Time
Behind the chatbot boom is a slower race over transformers, substations, fabs, and the people who know how to build them.
Technology • Analysis
The Battery Is Becoming the Grid
Grid batteries, electric cars, lithium supply chains, virtual power plants, and interconnection queues are turning storage from a gadget story into the shock absorber of the power system.

Systems • Deep Dive
The Cold Chain Is the Invisible Machine That Feeds the World
Refrigerated trucks, warehouses, vaccines, fish, fruit, insulin, power bills, refrigerants, and wasted food are all part of one hidden system: the cold chain.